flowchart TD
  A[Question and scope ⛰️] --> B[Preliminary infrastructure 🚧]
  B --> C[Individual Project scaffold 🏗️]
  C --> D[Data Lake Access 🌊]
  D --> E[Data Analysis and Notebooks 🔬]
  E --> F[Reusable Scripts and Pipelines 🗜️]
  F --> G[Collaborative Review and Communication 📊]
  F --> E
  G --> F
  G --> H[Publish and Archive 🗃️]
The end-to-end workflow 🧠
Let’s take some time to discuss and review an ideal workflow. This is a high-level overview of the lifecycle of a data science project in the lab — we’ll discuss actual implementation in the Guides sections. While the lifecycle may not be a strict linear process, it is a good starting point for understanding how to structure and prioritize your work at each stage, and what decisions you should be making to make your research reproducible.
1. Question and Scope ⛰️
These are the foundational elements of your science that you may discuss with your PI, your colleagues, your collaborators, etc. You may start by simply writing down things like:
- the scientific question,
- the unit of analysis,
- the key inputs,
- the expected outputs,
- and the likely compute or security constraints.
Much of this work can exist in Google Drive as meeting notes, lecture notes, and other communications. This is where you establish your motivation and high-level scientific field of interest.
2. Preliminary Infrastructure 🚧
Before writing any code, decide where the work belongs:
- publicly available data and identifiable data at or below security level 2 is appropriate for the standard FASRC environment, sometimes called CANNON; the vast majority of our lab work will fit this description;
- restricted data at security level 3 or above may require FASSE and a secure compute environment.
Additionally, think about which tools are best for the job. In this lab, we use R and Python, but the workflow principles apply to either and any other language you may use.
3. Individual Project Scaffold 🏗️
An individual project has three components: the Google Drive Data Lake, the local project repository, and GitHub repository.
On Google Drive, we maintain a strict folder structure for each Golden Lab research project.
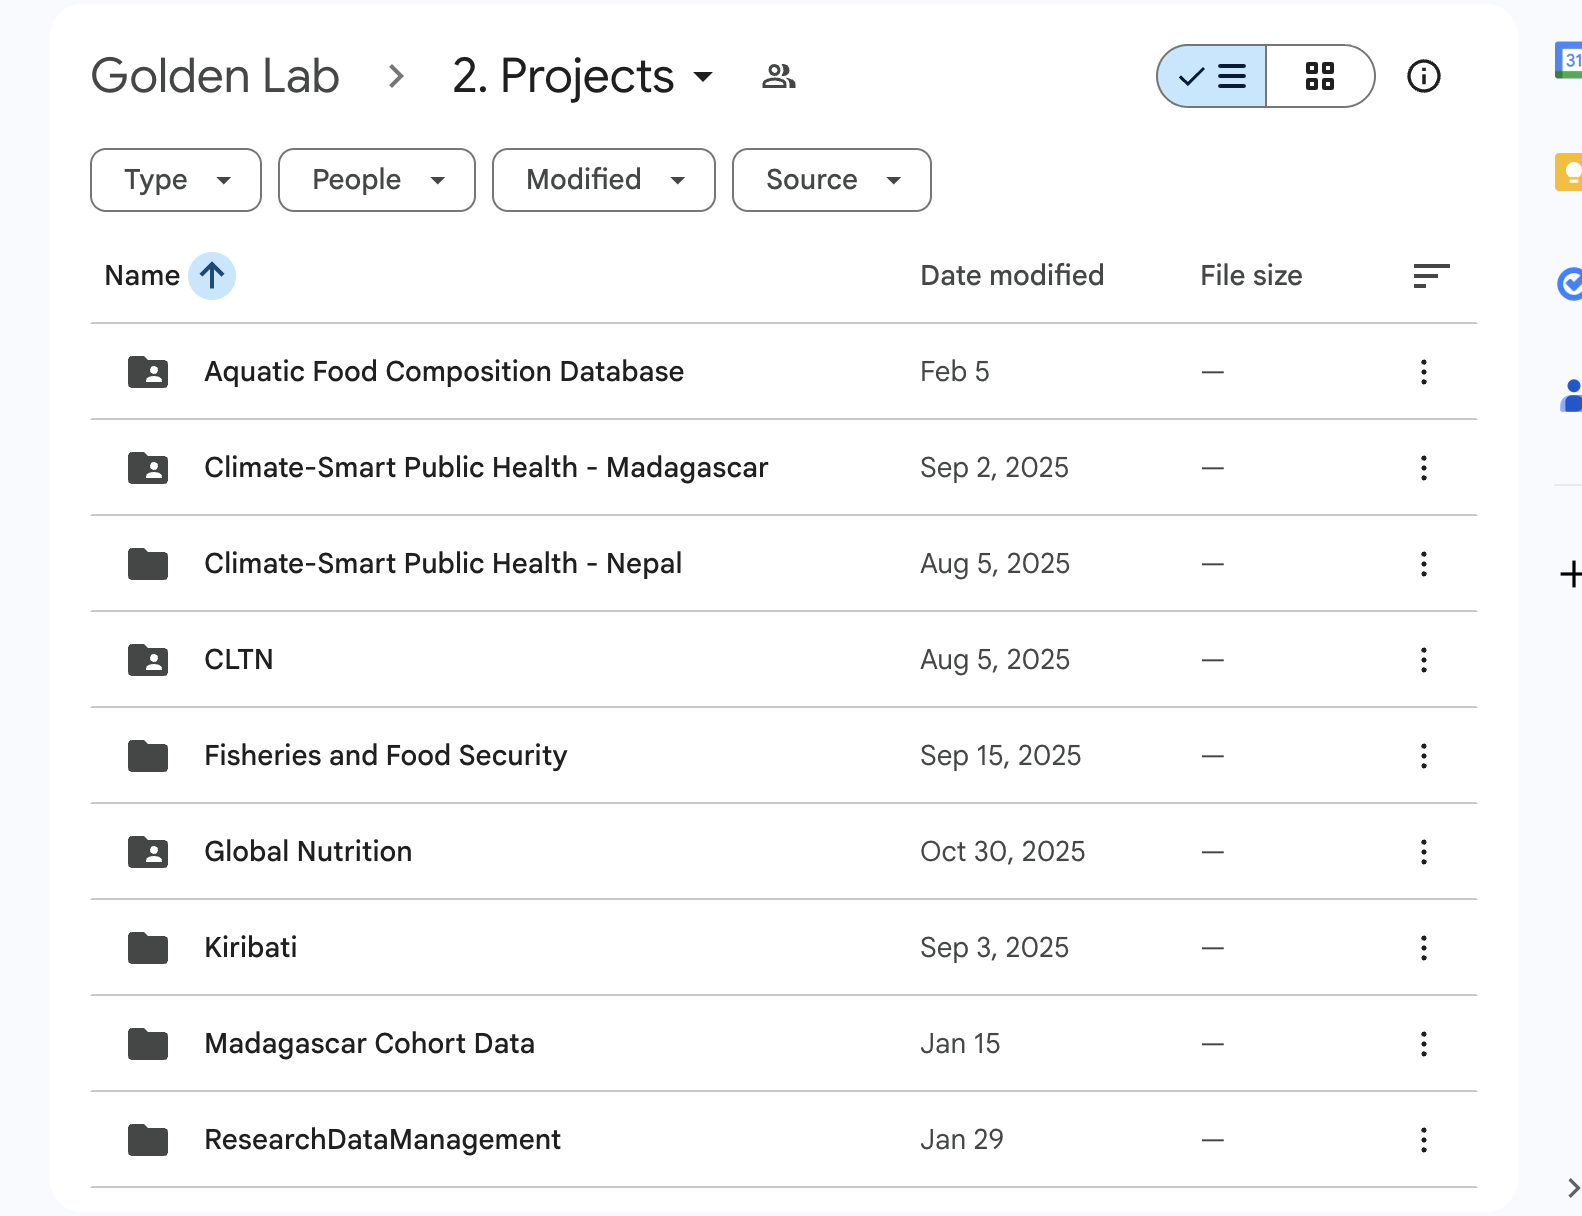
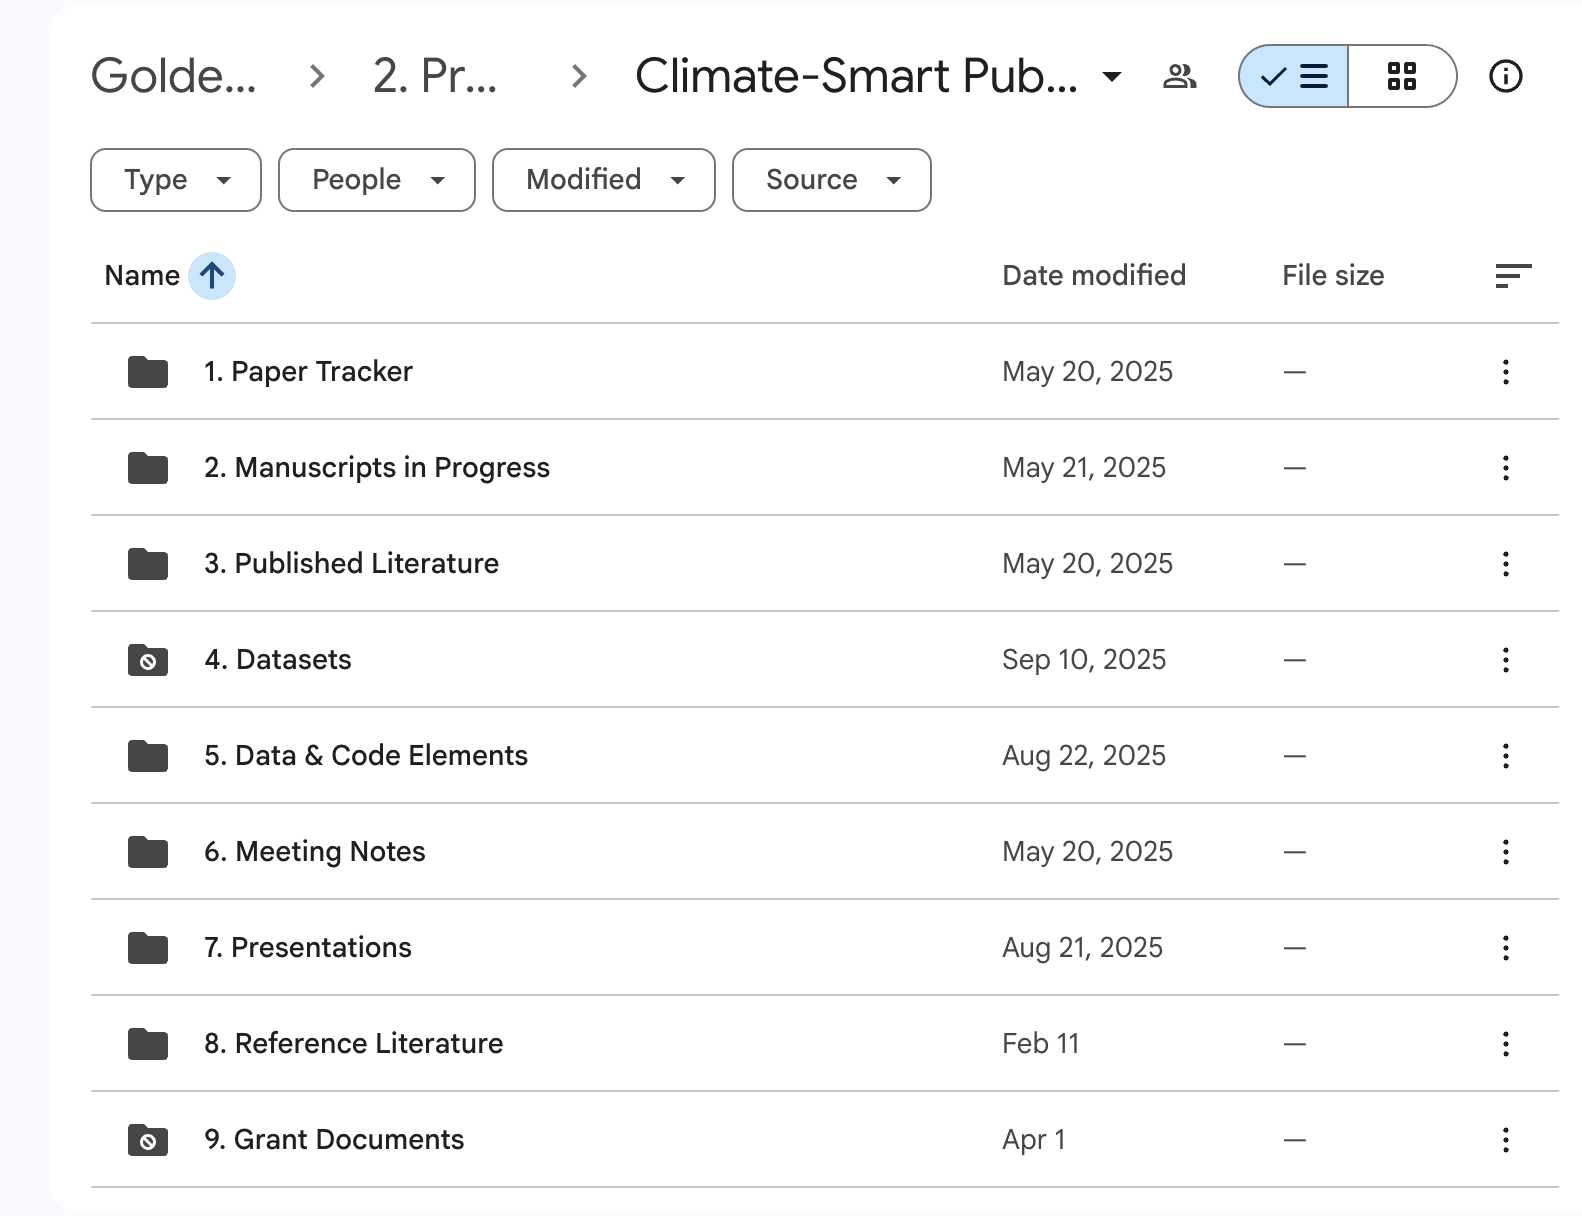
You’ll use these GDrive projects as information hubs for your individual research projects, which will be implemented on FASRC. For example, while the Golden Lab is broadly studying “Climate-Smart Public Health in Madagascar,” your individual project may be particularly interested in the relationship between heat stress and hospitalizations in Northeast Madagascar.
It’s important to maintain this structure so that there is a clear separation of concerns between high-level project management, the day-to-day work of data analysis, and the tools that each of those tasks require. Google Drive is a great place for taking notes with Docs, storing PDF files, and collaborating on office files manuscripts and presentations. FASRC is a great place for writing code, running analyses, and storing data and outputs. You wouldn’t want to write and store code files in Google Drive, and you wouldn’t want to maintain Google Docs files notes on FASRC — hence the clear separation of these environments1.
Even if you don’t have the dataset or specific hypotheses yet, now is the time to set up the local project repository. A good starting point might look like this:
project-name/
├── README.md       <- a clear project description and instructions for how to run the code
├── .gitignore      <- to exclude data, results, and other large files from `git`
├── data-outputs/   <- for intermediate and final data outputs
├── data-raw/       <- for linking your project to the data lake
├── code/           <- for plain code scripts, functions, and pipeline code
├── notebooks/      <- for exploratory notebooks and reports
├── manuscript/     <- for manuscript drafts, figures, and tables
└── lockfile        <- for package management and reproducibility
In addition, you should set up a GitHub repository for your project, and link it to your local repository.
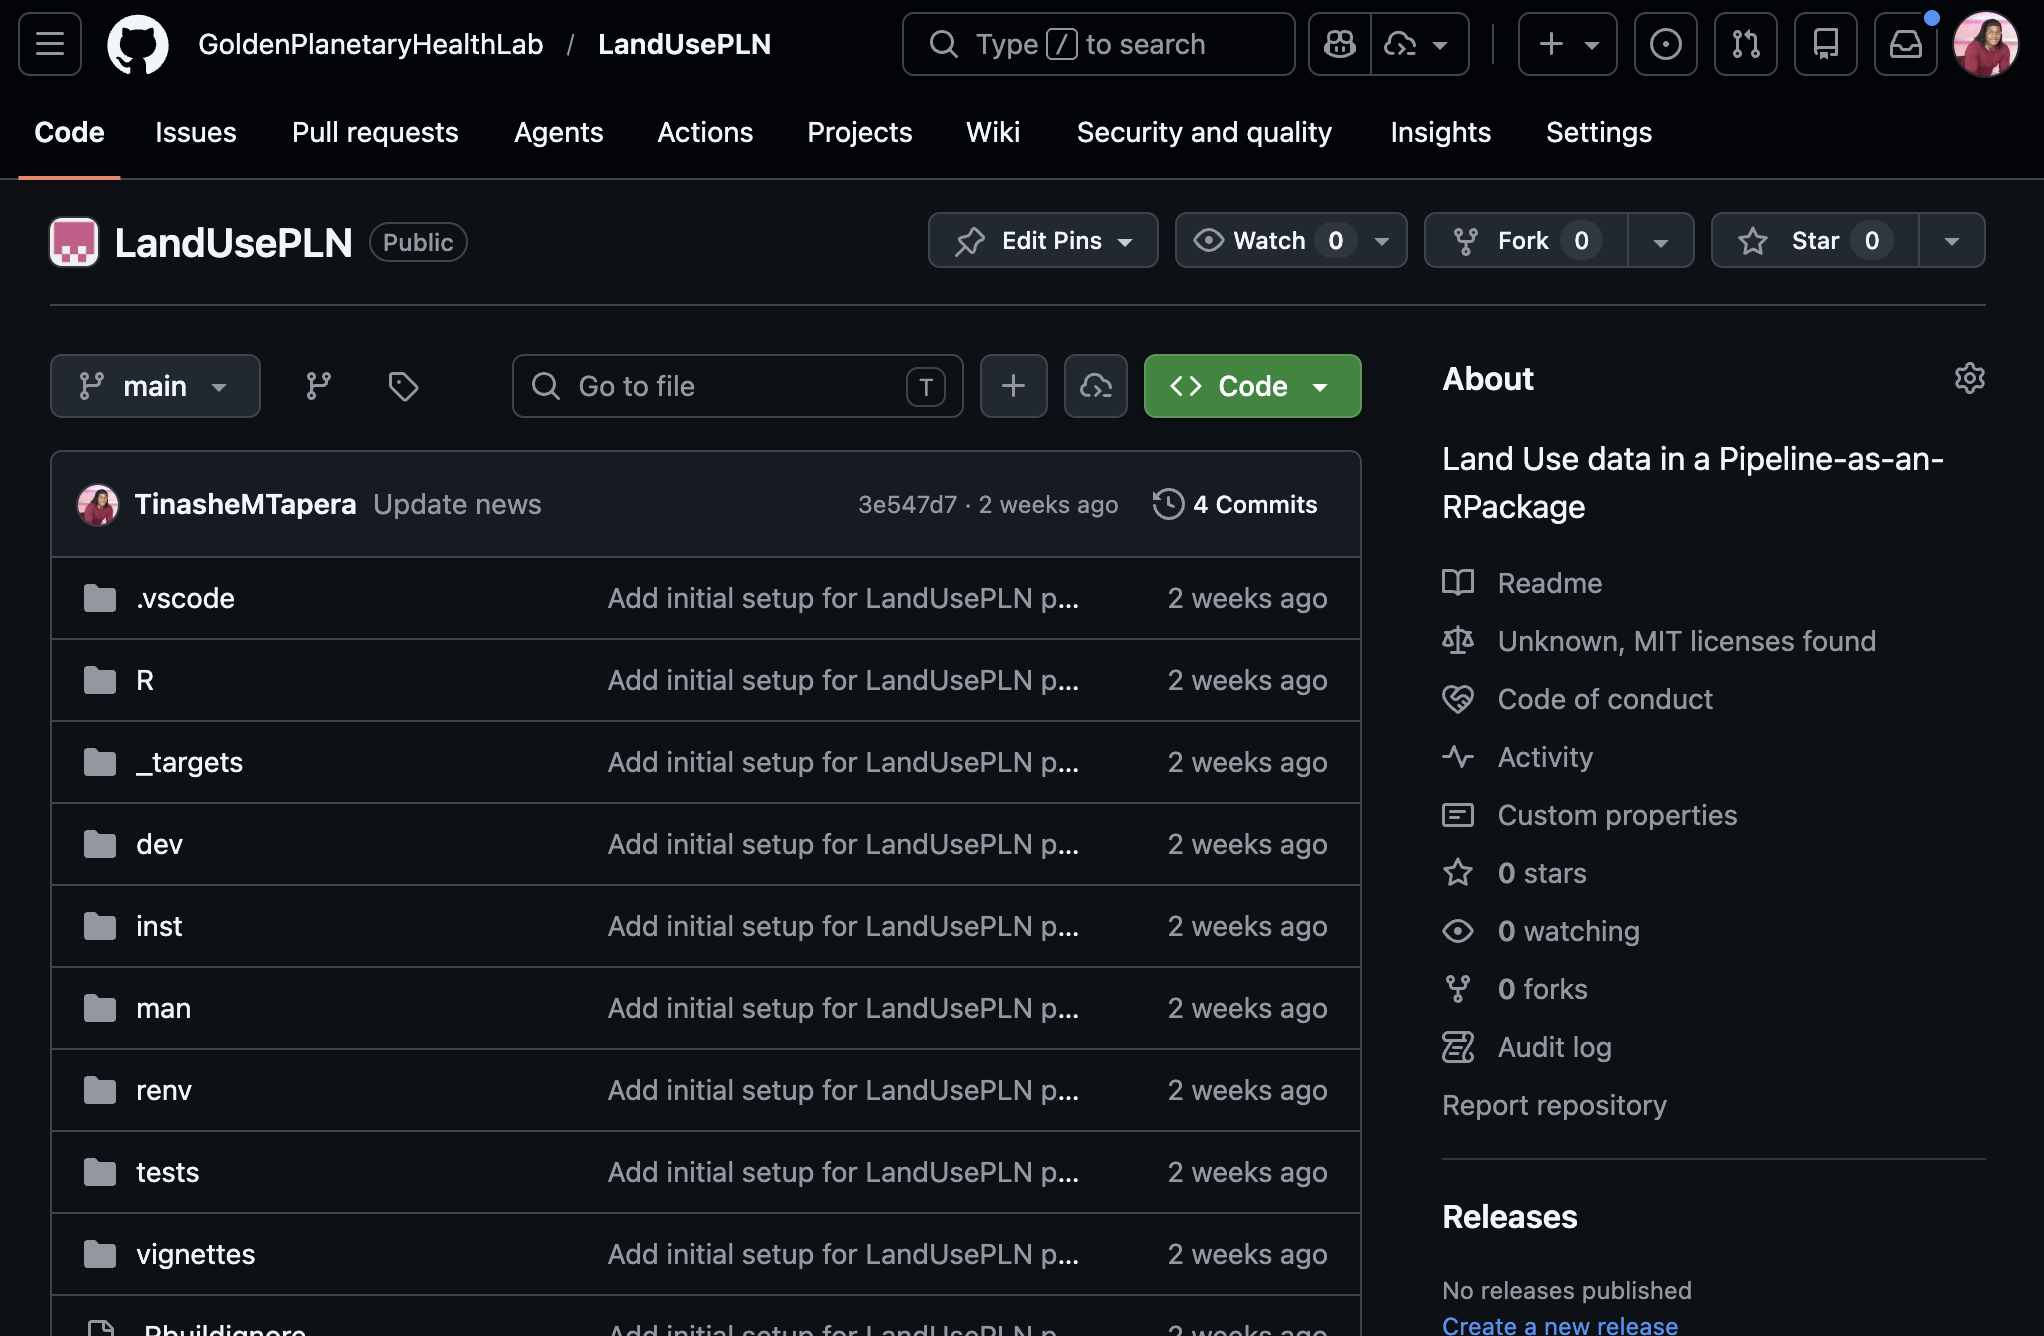
For each language, this may look slightly different, but the principle is the same. The sooner you set up the project scaffold, the more likely you are to to adhere to its conventions. If you wait until after you have a dataset, have written a few scripts, etc., you may find yourself copying and pasting code and data, missing git commits, or setting up inconsistent file paths, which is harder to maintain and reuse in future. Setting this up might feel like a chore, but we’ve gone ahead and done the work for you. Using our GitHub templates, you can easily create a new repository with the correct structure and fill in the blanks.
4. Data Lake Access 🌊
Most of our lab data exists on FASRC, and is specially curated to be accessible and secure. Recall the Golden Lab project folder structure on Google Drive:
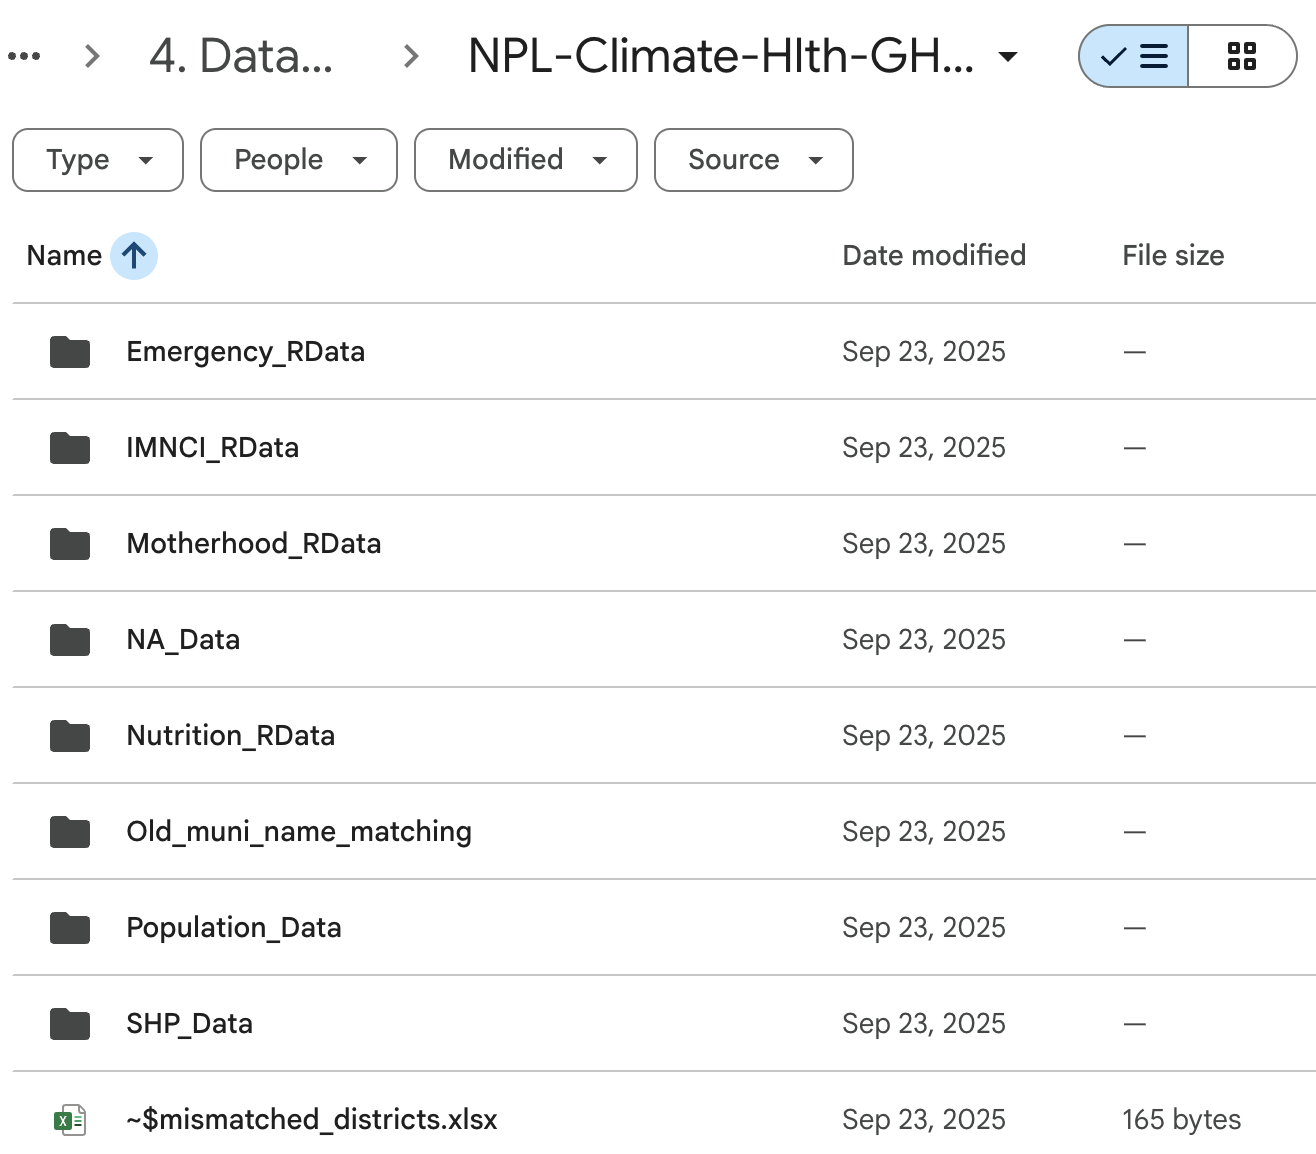
You’ll notice a locked folder called 4. Datasets. This is the raw data that Chris has been collecting over the years, and it is the starting point for all of our analyses. In order to interact with this data on FASRC, we set up a mirroring system that periodically syncs the raw data from Google Drive to FASRC using the rclone utility. We call this the data_lake, and it underlies how you can access the data on FASRC without having to download it from Google Drive, so you can be assured that it is up to date and secure2.
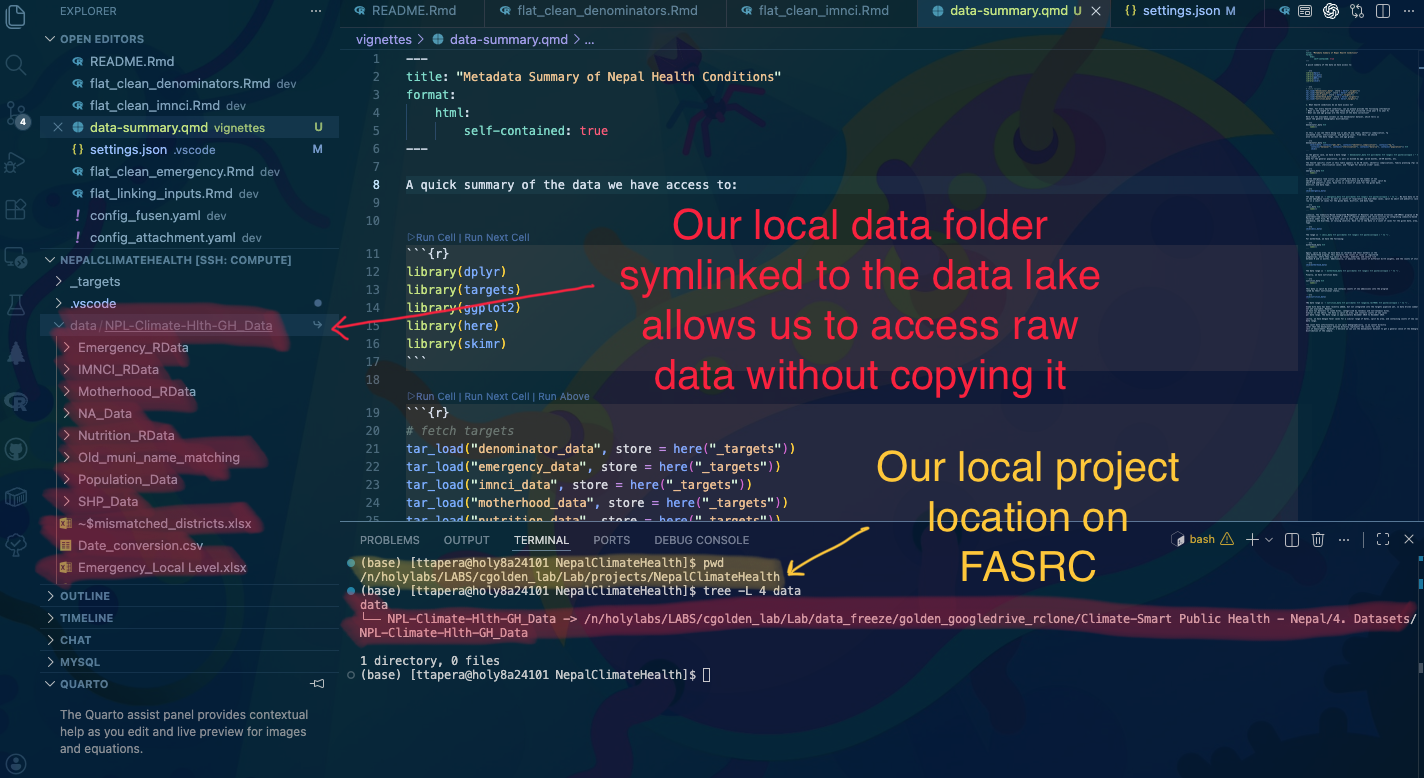
For any local individual project, the first step will be to symlink the project area’s raw data to your project repository. Fortunately, most data sources will come with an accompanying data distribution package that provides a function to do this for you. If it does not yet exist, let Tinashe know.
NoteWhy Do We Symlink Datasets?
“Symlinking” means to create a symbolic link to the original data file, rather than copying it. This has several advantages:
- It saves disk space, since you are not creating duplicate copies of the data.
- It ensures that you are always working with the most up-to-date version of the data, since the symlink “points” to the original file that is being synced from Google Drive.
- It maintains the security and integrity of the data, since you are not creating additional copies that could be accidentally modified or shared.
- It encourages you to create intermediate outputs and final results in your project repository without affecting the data lake.
By symlinking raw datasets, you can safely interact with raw data without being concerned about any data management tasks, allowing you to focus on the analysis and scientific questions at hand.
5. Data Analysis and Notebooks 🔬
Once you’ve symlinked the raw data, you can start doing the fun science. Notebooks are a great tool for this stage, since they allow you to write code, run it, and see the results all in one place. They also allow you to write markdown text to explain your thinking and document your process. I’ve heard it said that, “writing is thinking,”3 and writing code should be no different. As you write code, you should simultaneously be writing down:
- what you are testing,
- what assumptions you are making,
- what looks right, and what looks wrong,
- and what should happen next.
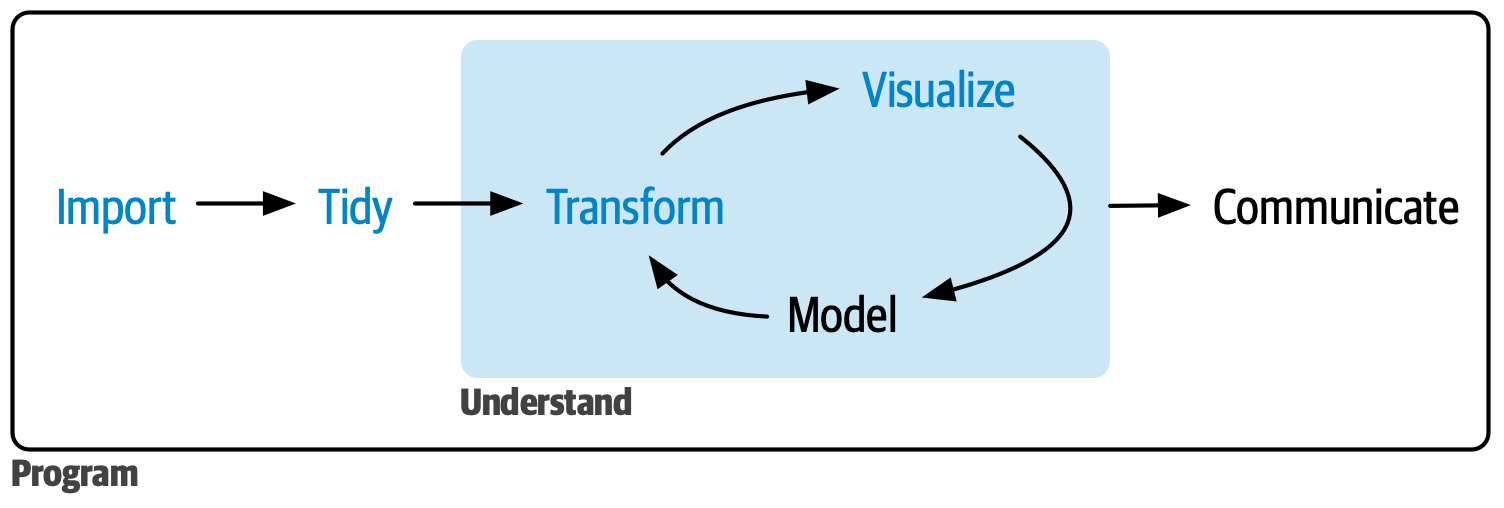
For example, R for Data Science treats communication as part of the data science loop, not a final wrapper placed on top of “real” analysis. That is the right model for lab work too.4
We recommend using Quarto for your notebooks, since it allows you to write in R, Python, or both in the same document, and it has great support for rendering and sharing your work. You can also use Jupyter Notebooks or R Markdown Notebooks if you prefer. The important thing is to choose a tool that allows you to document your thinking and share your work with others.
6. Reusable scripts and Pipelines 🗜️
Most scientific papers aren’t a once-off analysis. As you dig into the data, you’ll raise new questions that’ll require you to wrangle it in numerous ways — mutating variables, joining tables, and creating intermediate objects and visualizations that are used in different ways. You may also need to rerun analyses with different parameters, or on different subsets of the data. If you are doing this work in a single exploratory notebook or script, it can quickly become messy and hard to maintain.
We recommend starting off your project with a pipeline tool that allows you to record the progression of your data manipulations. Ideally, at the end of the project, a single pipeline should be able to take the raw data as input and produce all of the final results, including tables, figures, and manuscript drafts.
Coding pipelines are sometimes called DAGs, or Directed Acyclic Graphs, because they are a series of steps that are connected in a directed way (i.e., one decision leads to the next). This is a great way to structure your code, since it allows you to see the flow of your analysis and how each investigation (notebook) uncovered new challenges or ideas that led to the final result. It also allows you to easily rerun parts of the analysis if you need to make changes or update the data.
Once a workflow stabilizes, move repeated logic out of exploratory notebooks and into:
- scripts,
- functions,
- parameterized reports,
- all managed by a pipeline orchestration tool such as
targets,pytask, orsnakemake.
The trigger is simple: if you expect to rerun it, scale it, or hand it off, it should not live only in an exploratory notebook cell.
NoteIs A Pipeline Orchestration Tool Overkill?
We get it, you’re not trying to be a data engineer — you just want to publish papers. But the reality is that if you are doing data science, you are doing data engineering. If you are writing code that manipulates data, even in just a handful of lines, you are engineering a solution to a problem. The question is not whether you should use a pipeline orchestration tool, but rather when you should start using one.
The sooner you do this, the better. If your project were to scale (which it almost certainly will), you’ll have a hard time retroactively moving code around into a pipeline, and you’ll likely end up with a messy codebase that may not be reproducible. Adding a pipeline orchestrator early on costs very little, and it allows you to focus on the science without worrying about the engineering later.
7. Collaborative Review and Communication 📊
As you go through the exploratory data analysis phase, you’ll likely be meeting with your PI and collaborators to discuss analysis results and brainstorm ideas. It wouldn’t be very wise to show up to a meeting with half a dozen arbitrarily named Python scripts or R scripts, and expect everyone in the meeting to understand your work. Instead, you should collect and export digestible findings that can be presented in meetings5.
If you’ve structured your project correctly, each time you meet with your supervisor or collaborators, your project should have:
- an up to date
READMEat the base of the repository that explains the project, how to run the code, and when it was last updated, - one or more current notebooks or reports that explain the current analysis status,
- the reproducible path from data inputs to results in a pipeline, and
- a
githistory that reflects real milestones.
This makes supervisor meetings, methods review, and cross-training materially easier.
NoteThe Data Science Loop
You may notice that the workflow has cyclical edges between Data Analysis & Notebooks, Reusable Scripts & Pipelines, and Review & Communication. This Data Science Loop is a continuous cycle of analysis, interpretation, and communication. As you analyze your data, you’ll likely uncover new questions and insights that will lead to new analyses. This is a normal part of the scientific process, and it’s important to embrace it. By structuring your project in a way that allows for easy communication and collaboration, you can make the most of this iterative process and produce high-quality science.
8. Publish and Archive 🗃️
When you and your collaborators are ready to publish or transition ensure that your project is in a state that can be easily shared and maintained. This includes:
- confirming the repository can be cloned from GitHub and run from scratch,
- confirming restricted data are not in Git,
- confirming documentation identifies canonical data locations,
- rendering a final report or project website,
- and recording ownership for future maintenance.
Depending on your publication venue, you may also want to archive your code and data in a more permanent repository, such as Dataverse or Zenodo, and link it to your publication. Additionally, you may want to add credential badges to your GitHub repository to communicate the quality of your work, such as FAIR software, a Zenodo DOI badge, or a GitHub Actions CI/CD badge that shows the status of your pipeline.
Conclusion
While this workflow may seem daunting at first, it gets easier with practice. The key is to start early and be consistent. By following this roadmap, you can ensure that your work is reproducible, maintainable, and scalable.
Footnotes
But just because they are separate, doesn’t mean they are not connected. We will learn how these entities are linked together in following sections.↩︎
You can see the status of the last sync by visiting the research data management dashboard at [#TODO: implement RDM dashboard to monitor sync status].↩︎
“Writing is thinking. To write well is to think clearly. That’s why it’s so hard.” — David McCullough. Also, see: https://www.nature.com/articles/s44222-025-00323-4.↩︎
Hadley Wickham, Mine Cetinkaya-Rundel, and Garrett Grolemund, R for Data Science (2e): Communicate.↩︎
This is where notebooks can really add value to your data analysis. If your notebook is structured correctly, you can easily export tables, graphs, and text as a report that weaves together your code, results, and interpretations reproducibly, and share it with your collaborators.↩︎